This blog post is in reference to my article in the May 2023 edition of the Lancet Psychiatry – Lithium Story: Eight Guidelines, Eight Recommendations. It is adapted from notes I sent to one of the editors when constructing the article
In a previous blog post, I looked at two examples of imprecise language in a Grandjean and Aubry paper about lithium pharmacokinetics (which I used in my May 2023 Lancet Psychiatry article). In this post, to show that the problem is not limited to a single paragraph in a single review paper, I have included a couple more examples of unclear messaging.
Example 3: “Typically, it has been considered that lithium concentrations should be maintained between 0.6 and 1.0 mmol/L”
This quote is from the Grandjean and Aubry paper, section 3.2: “Optimal Plasma Concentration Range: High versus low concentration”, first paragraph.
When the author mentions that “lithium concentrations should be maintained between 0.6 and 1.0 mmol/L” I think the values they are referring to are about a serum sample taken at 12 hours. However, I cannot be certain.
This particular example of lack of clarity is prominent in the literature .
All doubt could be removed with the short simple statement: “all serum concentration values mentioned in this section refer to 12-hour levels”. Even better, use the abbreviation introduced by Amdisen before each serum concentration mention (e.g. “a 12h-stSLi between 0.6 and 1.0 mmol/L”). It is such an easy fix.
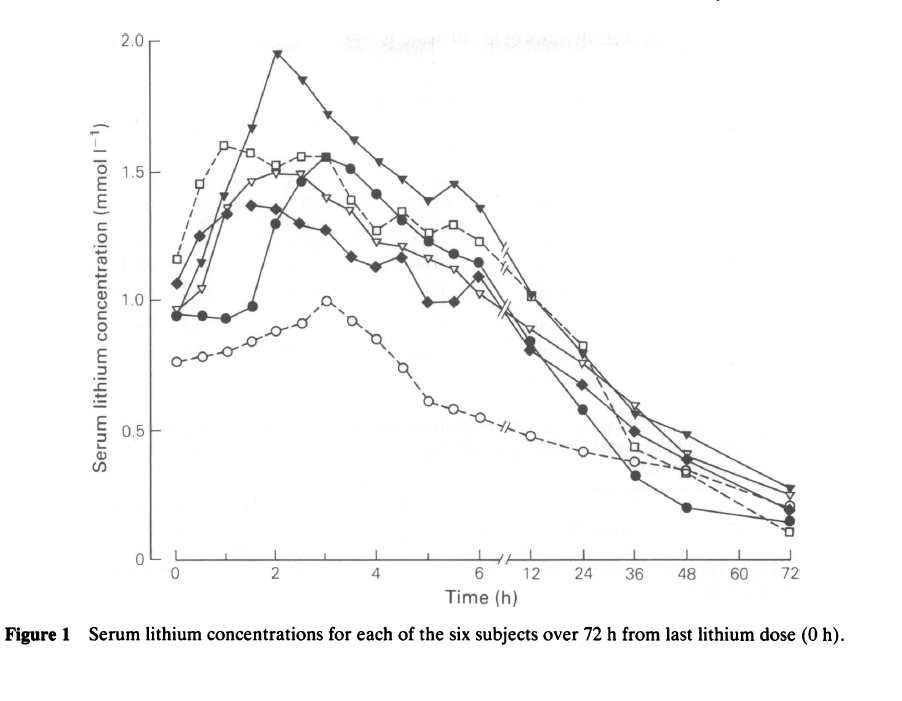
Example 4: Steady-state pharmacokinetics of lithium carbonate in healthy subjects by R Hunter, Figure 1
The figure I am referencing in this example is the graph I have included in the appendix of my Lancet Psychiatry article. Here is the figure taken directly from a paper by Hunter :

The biggest problem with this graph is that the figure caption doesn’t say which line symbol corresponds to each subject. In fact, it isn’t even mentioned in the main text. It is possible to work it out from the values given in Table 2, but this makes it easy for mistakes to be made by the reader.
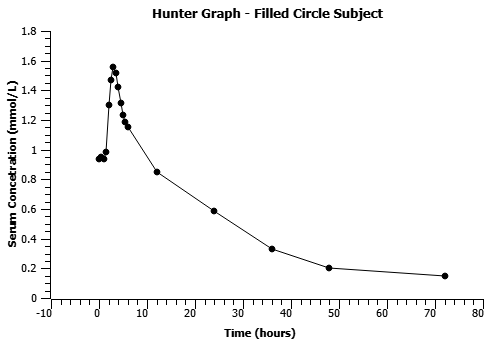
Further, the plot is misleading. I really don’t like the two scales used for the x-axis (I would have scaled the x-axis properly and then used an inset graph, top right, to show the 0 – 6 hour values in detail). The improper scaling makes it look like each subject’s pharmacokinetic curve after peak concentration follows a one-compartment model (instead of the two-compartment model of lithium ).
I have made a very quick plot below of the subject represented by the filled circles with proper scaling for reference.

